Understanding Basal Body Temperature aka BBT
Basal body temperature, or BBT, is the resting temperature recorded after a long stretch of sleep. It reflects how reproductive hormones shift through the menstrual cycle.
Progesterone is the key hormone that affects BBT, and its rise after ovulation creates a measurable change. This makes BBT a practical tool for understanding the cycle from one morning to the next. BBT is usually taken with a thermometer that reads to two decimal places, so the normal thermometer we use to measure our temperature won't do it. A consistent routine helps produce reliable results. Many people take the reading at the same time each morning after at least three hours of uninterrupted rest before getting out of bed. Even small changes in sleep, alcohol intake or illness can influence readings, so the aim is to capture data in a calm and steady setting.
What BBT Tracks
A typical chart has two temperature zones. The first zone appears before ovulation, and the second appears after ovulation.
The shift between the two zones tells a story about hormonal activity.
• Pre-ovulatory temperatures: These tend to be relatively low and stable because estrogen is the dominant hormone in the early cycle. Estrogen does not raise temperature. Instead it prepares the body for ovulation.
• The temperature shift: Once ovulation happens, progesterone rises and creates a small but sustained increase in temperature. This rise usually appears within a day or two of ovulation. Charting often reveals a clear cluster of higher readings after this point.
• Post ovulatory temperatures: These stay elevated while progesterone remains high. They drop again at the end of the luteal phase when progesterone falls and the next cycle begins. People who chart their temperatures often look for a confirmed shift that lasts at least three days. That shift helps verify that ovulation already occurred.
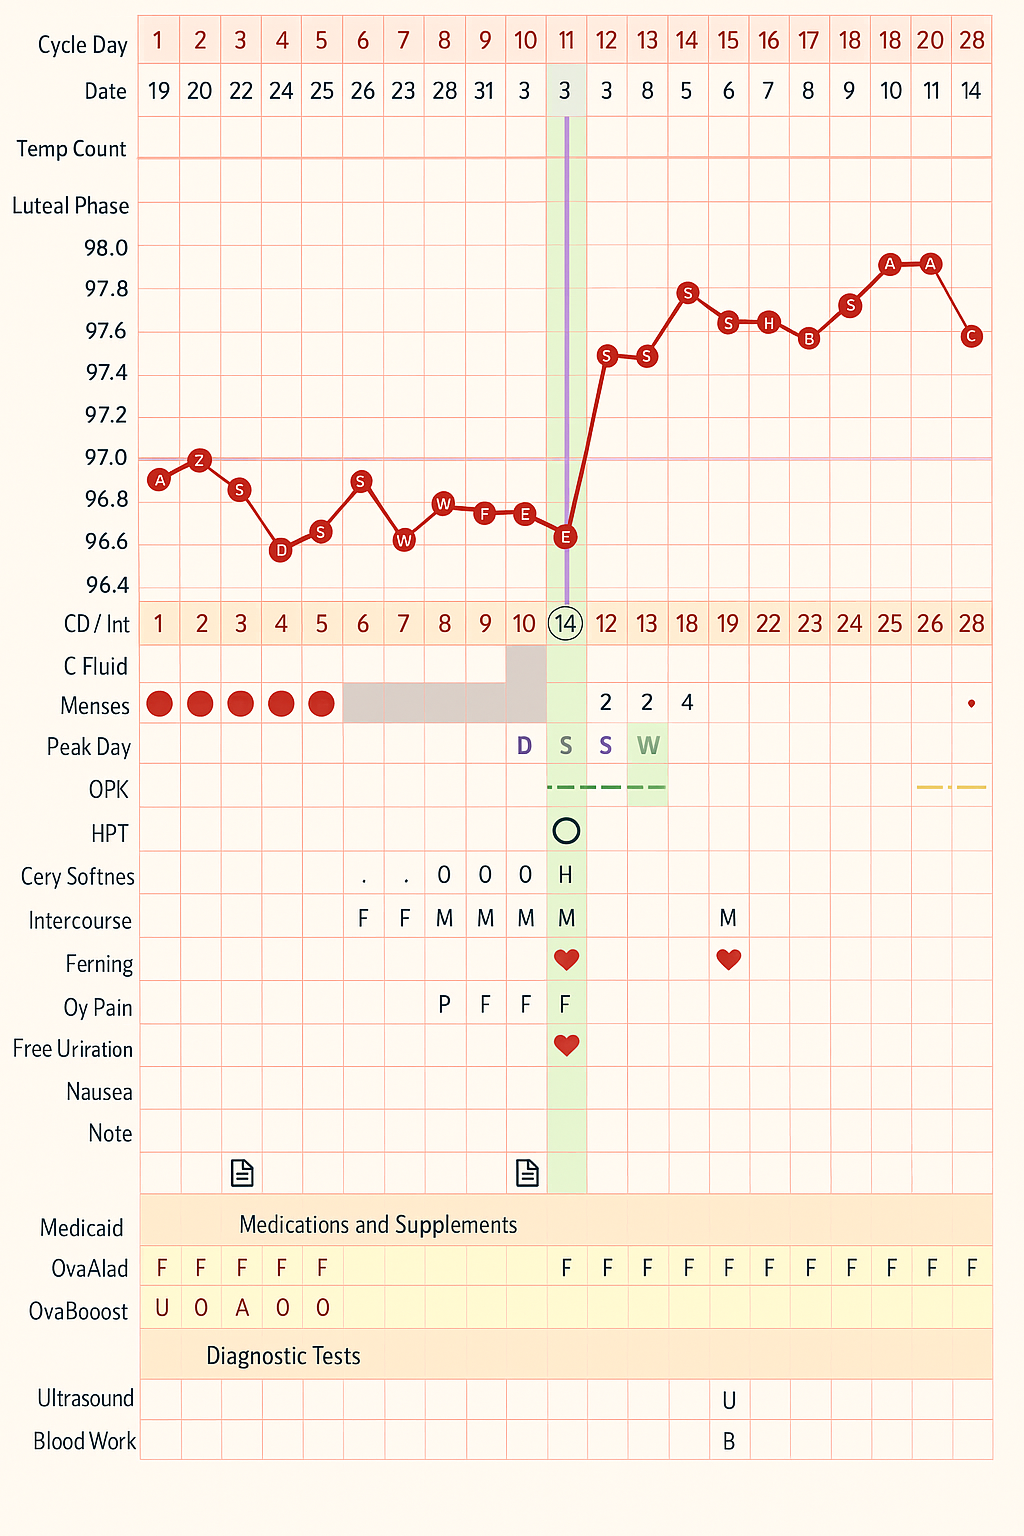
How the Chart Patterns Looks Like
A common pattern shows a cluster of lower temperatures in the first half of the cycle, followed by a clear upward shift once ovulation has passed. The higher readings stay fairly steady through the luteal phase and then drop again near the start of the next period.
It can help to imagine the chart in three parts.
• The early cycle usually shows a smooth line with small daily variations.
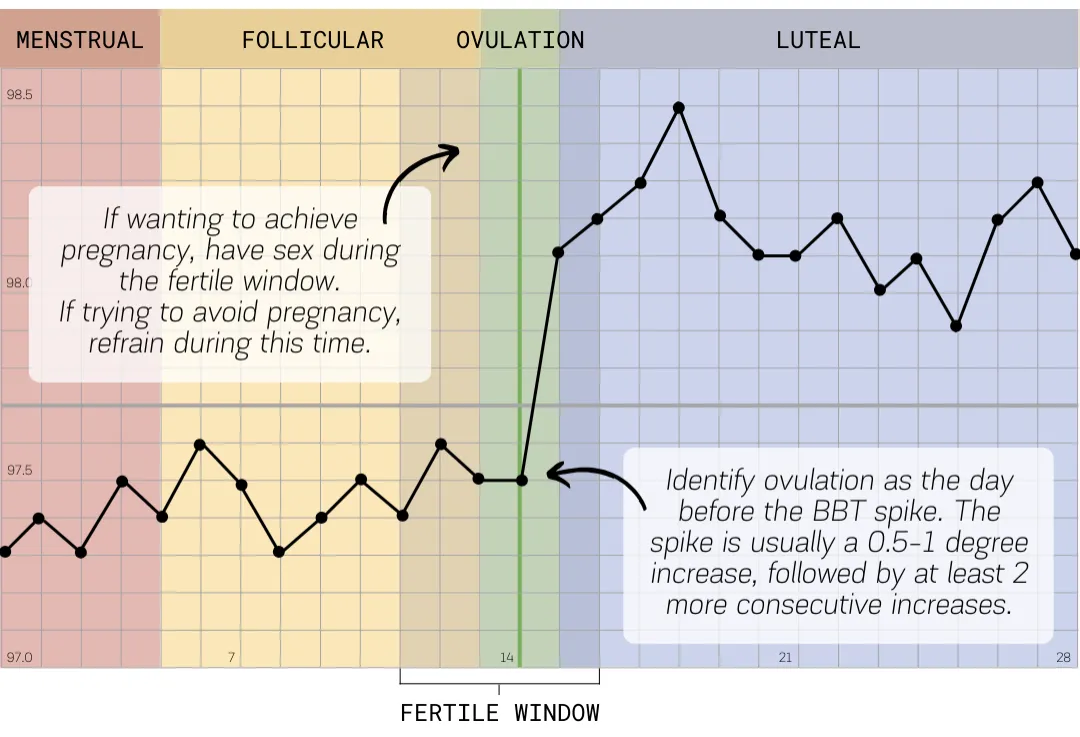
• The ovulatory shift appears as a noticeable rise that holds for at least three days.
• The luteal phase creates a higher plateau that stays elevated until progesterone falls.
This kind of chart is considered textbook. Many people still have perfectly healthy cycles that don’t look this tidy. Illness, stress, sleep changes, travel, medications and shift work can influence single temperatures or whole sections of a chart. The goal is to understand personal patterns. BBT may look something like this:
Why BBT Rises After Ovulation
Once ovulation occurs, progesterone becomes the dominant hormone. One of its side effects is a small rise in resting temperature. Many people see an increase of about 0.5 to 1°F (0.22 to 0.56°C), though the exact amount varies from cycle to cycle. This higher temperature pattern continues through the luteal phase and holds until progesterone drops again right before the next period. If the temperature stays elevated longer than usual, it can sometimes be an early sign that pregnancy has occurred.
The Importance of Ovulation
Ovulation matters even when pregnancy is not a goal, because it signals that the entire hormonal cycle is functioning as it should. A healthy ovulatory cycle produces balanced levels of estrogen and progesterone, and these hormones support many aspects of long-term wellbeing. Progesterone helps stabilize mood, supports bone strength, influences metabolism and contributes to regular, predictable cycles. Estrogen in balanced amounts supports cardiovascular health, skin integrity and cognitive function. When ovulation is sporadic or absent, cycles often become unpredictable and symptoms like heavy bleeding, acne, migraines or pronounced PMS can show up.
Tracking ovulation gives people a clearer view of how their bodies are working and can offer early clues when something feels off, even when pregnancy is not part of their plans.
How BBT Fits into the Fertility Awareness Method (FAM)
Fertility Awareness Methods, often called FAM, use observable body signs to understand when fertility is highest and when it has passed. This system is built on daily observations, consistent charting and interpretation of patterns over time. Many people appreciate FAM because it deepens their understanding of reproductive health and can be adapted for either conception or birth control.
Core Components of FAM
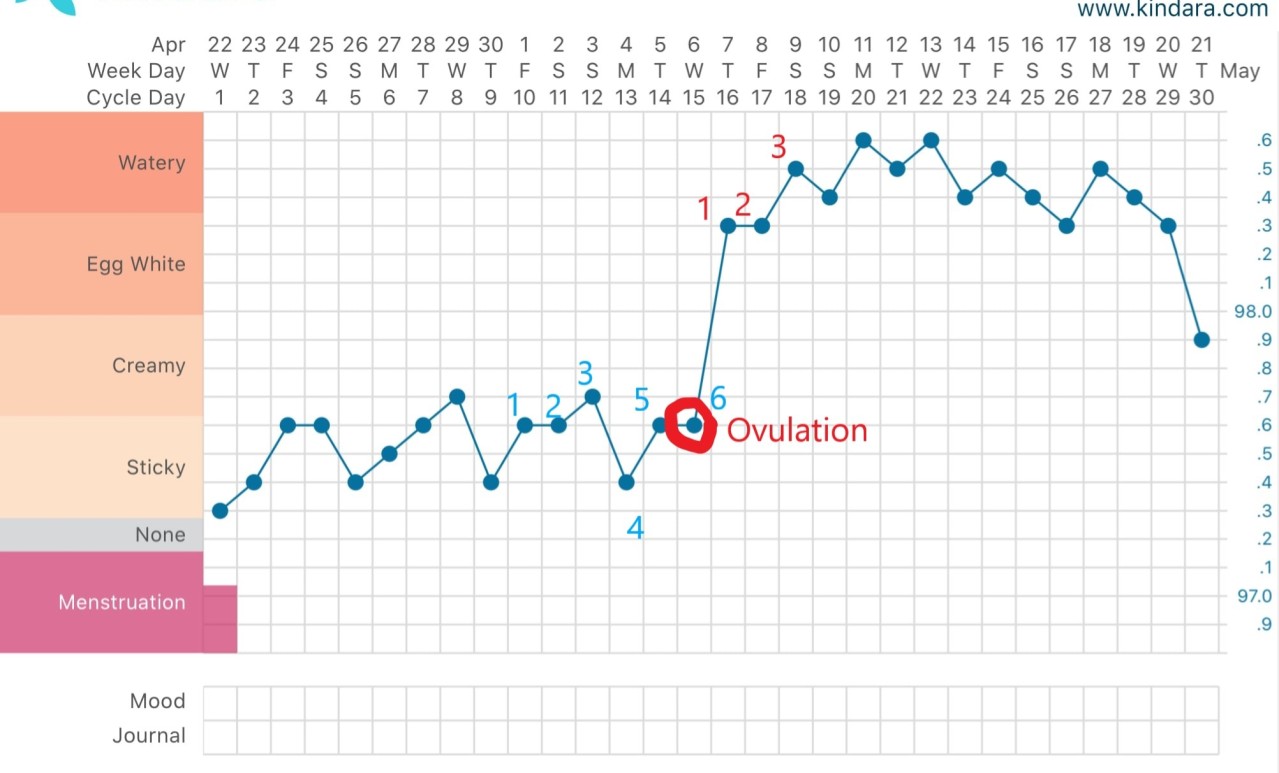
Cervical Mucus
Cervical mucus is one of the most informative signs. The cervix produces mucus throughout the cycle, but the texture and appearance change under the influence of estrogen and progesterone. Here are the most common types:
Basal Body Temperature
BBT confirms that ovulation has already happened. When combined with mucus observations, the two create a fuller picture of fertility timing. Mucus signals approaching fertility. BBT signals the close of the fertile window.
Connecting the Dots Across Your Cycle
Ready to Explore Your Cycle More Deeply?
If you’re curious about diving into the practice of cycle-syncing, I created a free guide that breaks down lifestyle, diet, and workout strategies for every inner season of your cycle. It’s practical, easy to follow, and a great way to start syncing with your body.
👉 Download your free “Cycle Syncing: Diet & Workouts” guide here.
With the right knowledge, you’ll see that your cycle is actually a powerful tool to live with more energy, balance, and ease.
Want to Go Even Deeper?